We are excited to launch a fresh instalment in our blog series aimed at delving deeper into the diverse functionality of BanyanBoard. In our initial blog that explored BanyanBoard's role in post-game video tagging, we saw that the tagging system in BanyanBoard enables users to rapidly pinpoint significant game instances. This time around, we will be exploring how BanyanBoard can be instrumental in realizing a wide array of outcomes, from enhancing broadcasting experiences to creating interactive fan engagement dashboards.
In this blog, we'd like to shine a spotlight on a particular outcome of using BanyanBoard, one that's highly relevant in today's sports landscape - Live Sports Streaming. Live streaming of sports events has become a staple in our digital age, with platforms like YouTube, Facebook and Twitch leading the charge. Despite this growth, real-time match statistics belong predominantly to the realm of high-budget broadcasters, leaving a vast majority of fans of live streaming with little to no real-time statistics. This is where BanyanBoard steps in. It acts as a bridge, filling this void by providing real-time statistics to fans, broadcasters, and event organizers alike. BanyanBoard accomplishes this by recording match events and summaries, then leveraging advanced analytics to generate immediate, actionable insights. Let's delve into how someone can use this feature in BanyanBoard to enhance sports broadcasting and viewing experiences.
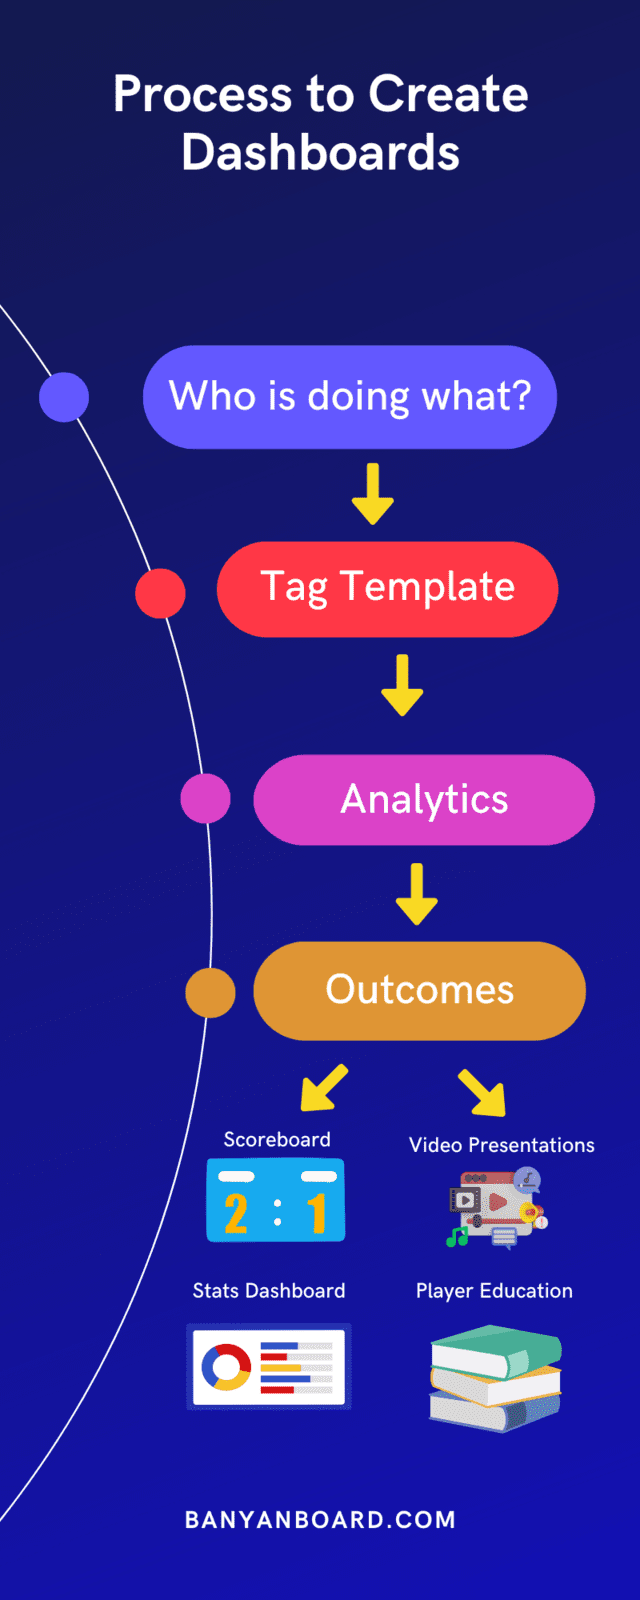
We're going to navigate through a multi-step process that outlines how to optimally leverage BanyanBoard's capabilities for live sports streaming.
The first step involves deciding which statistics should be displayed in graphic overlays. Here, we recommend adopting a generic approach that can be applied to any sport. The guiding question to facilitate this process is, "what" are we trying to describe about "who". This leads us to establish a tagging template where the 'who' becomes the primary category, and the 'what' acts as the label. For guidance on these terms, please refer our earlier blog.
Step two is to setup a tagging template with convenient short-cut keys, colour codes for buttons, roll times etc. to apply these primary categories and label using BanyanBoard's Tagger module. For a comprehensive understanding of this process, we recommend revisiting our previous blog post that explains how to set up primary and secondary categories and labels within tagging templates.
Moving to step three, customization of your dashboard's aesthetics comes into play. This is where we pick from a template of pre-defined dashboards and customize it's look and feel. An example screenshot is shown below showcasing how BanyanBoard allows users to modify colours and fonts of the dashboard to their liking, thereby enhancing personalization and user experience.
In the fourth step, we'll utilize BanyanBoard's Tagger app to record events with the appropriate tags during the live stream. All the categories and labels defined in step two via the tagging template appear automatically as buttons on the Tagger app. A screenshot is provided to demonstrate this process, showing how BanyanBoard's Tagger app makes this process intuitive and user-friendly.
Finally, the fifth step highlights the seamless integration of BanyanBoard with video production software. BanyanBoard empowers producers by providing a single web URL that allows them to access multiple dashboards. These dashboards can be dynamically altered based on the current state of the game, thereby offering producers hassle-free switching of dashboards for their broadcasts.
The infographic below summarizes these steps.
As an example, let's apply the multi-step process to the outcome of incorporating statistics into a live stream for squash games.
In the first step, we will need to identify the statistics to be displayed in the graphic overlays, such as scores, unforced errors, and winners for Player A and Player B. This decision is made by applying the 'who is doing what' formula, where 'who' refers to the player, and 'what' refers to the event or action.
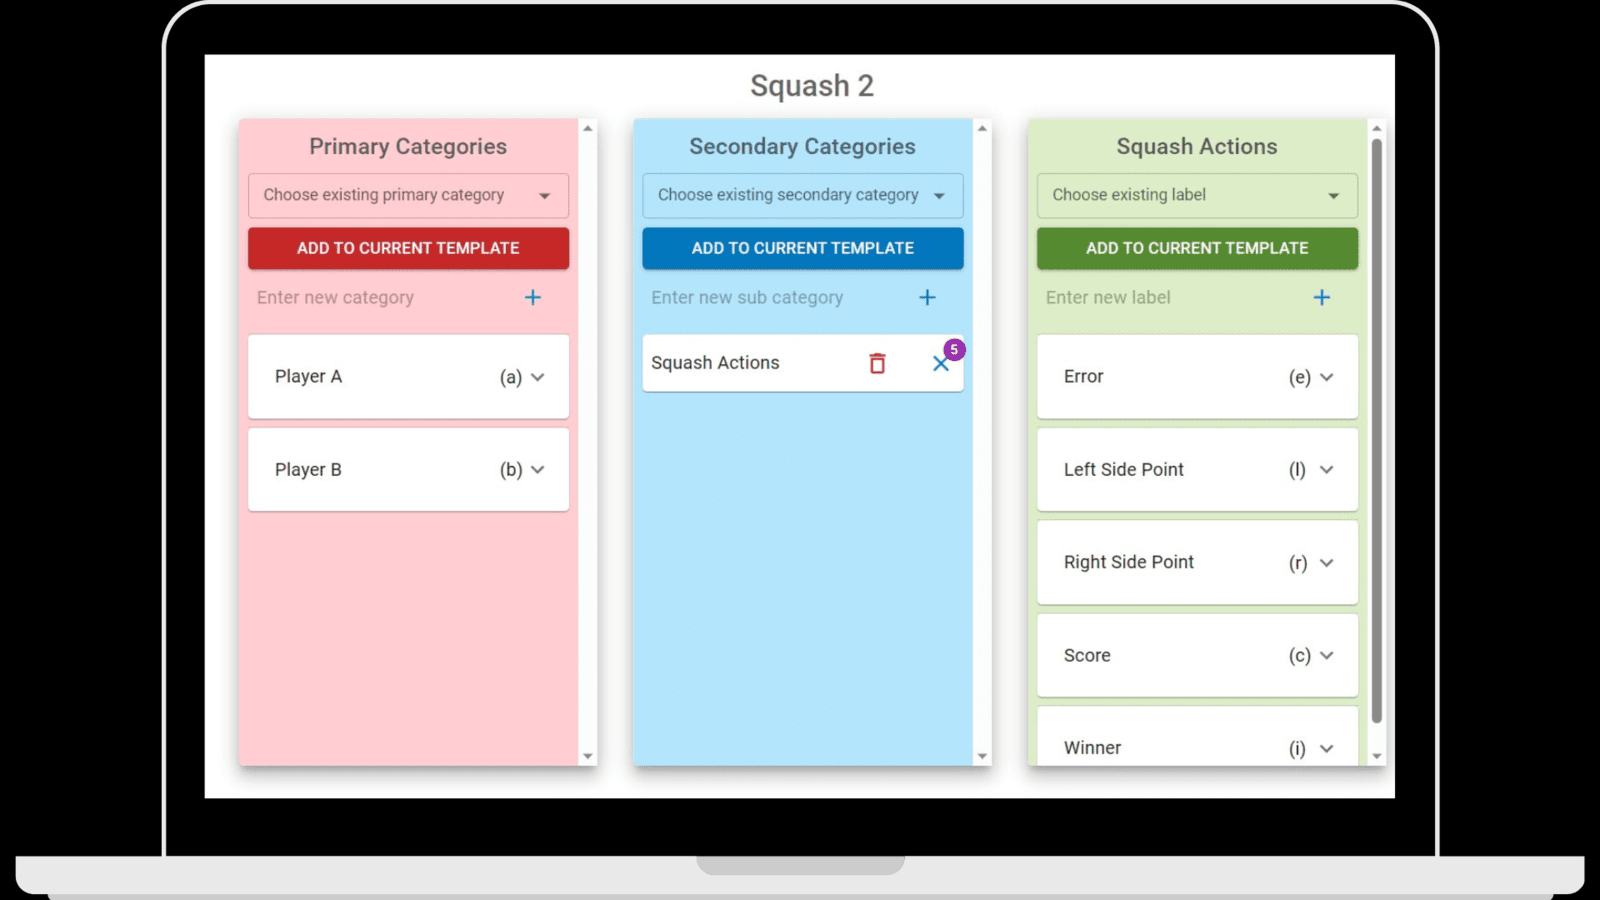
For the second step, we move on to planning how to tag these events. Using our earlier blogs as a reference, we'll set up our primary and secondary categories and labels within the tagging templates for this squash game. In this case, the player (either Player A or Player B) will need to be assigned as the primary category, embodying the 'who'. Events, such as unforced errors, winners, or scores, represent the 'what' and will need to be assigned as the labels. An example tagging template looks like below.
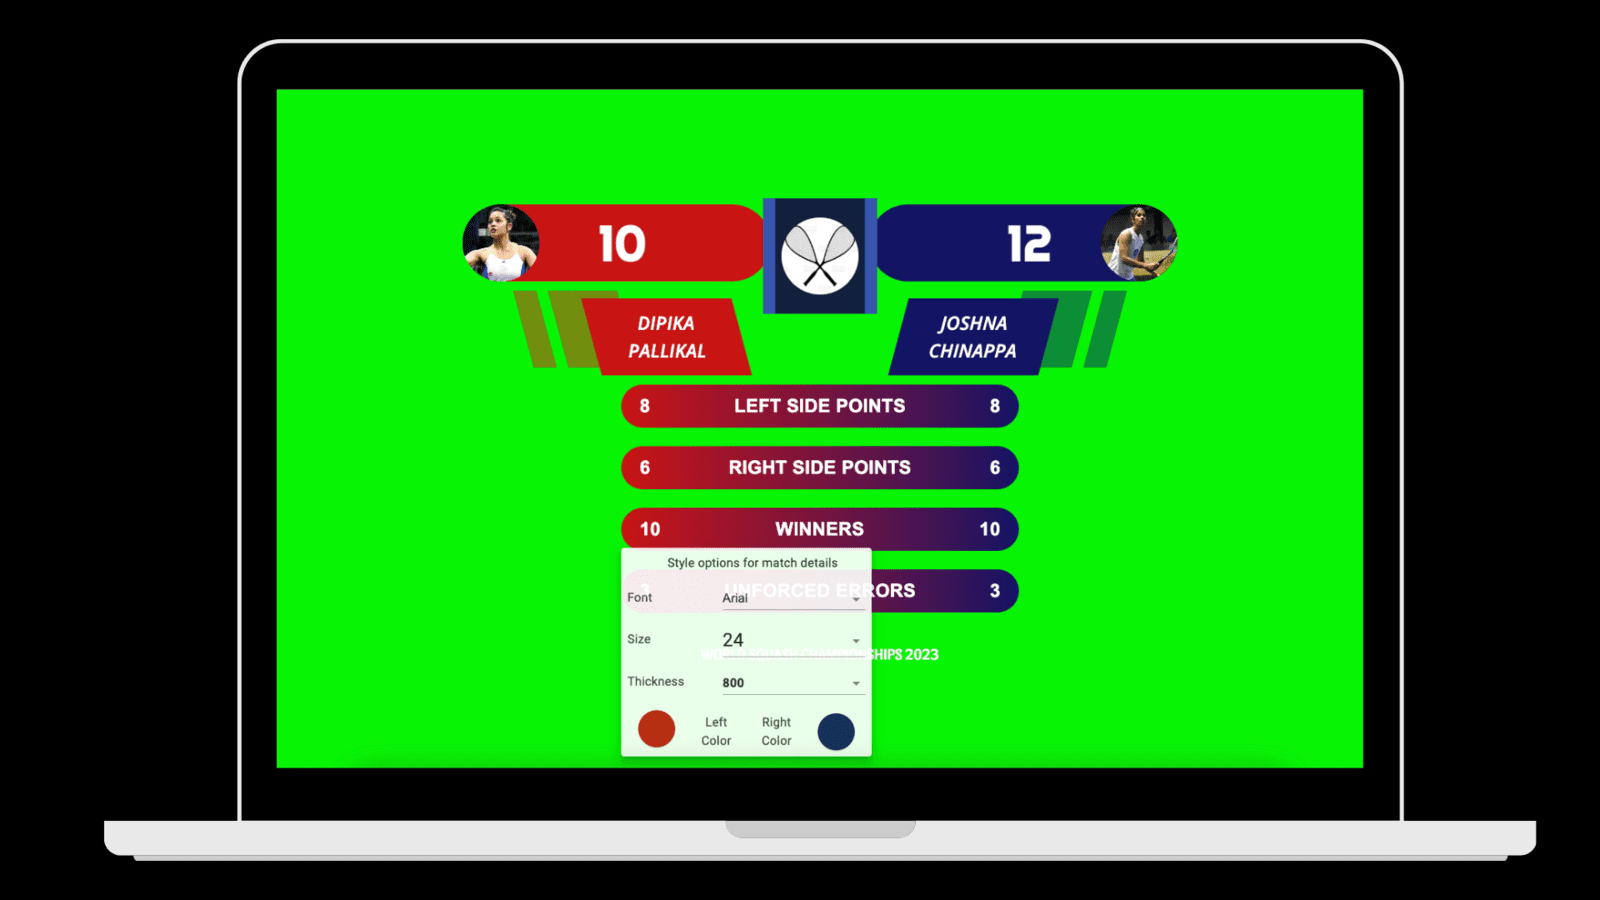
In the third step, we'll customize the look of our dashboard. This might include adjusting colours and fonts to match the branding or aesthetic of the squash tournament or broadcaster. An example of this is displayed below.
Step four involves using BanyanBoard's Tagger app to accurately record these events with the appropriate tags during the live stream. We may notice that there's a potential for lots of events to be recorded and each of these could require a number of tags. To streamline this process and ensure we capture all essential actions in real-time, it may be beneficial to use keyboard shortcuts. These shortcuts can considerably speed up the tagging process, allowing for quick and efficient logging of the ongoing events in the squash game.
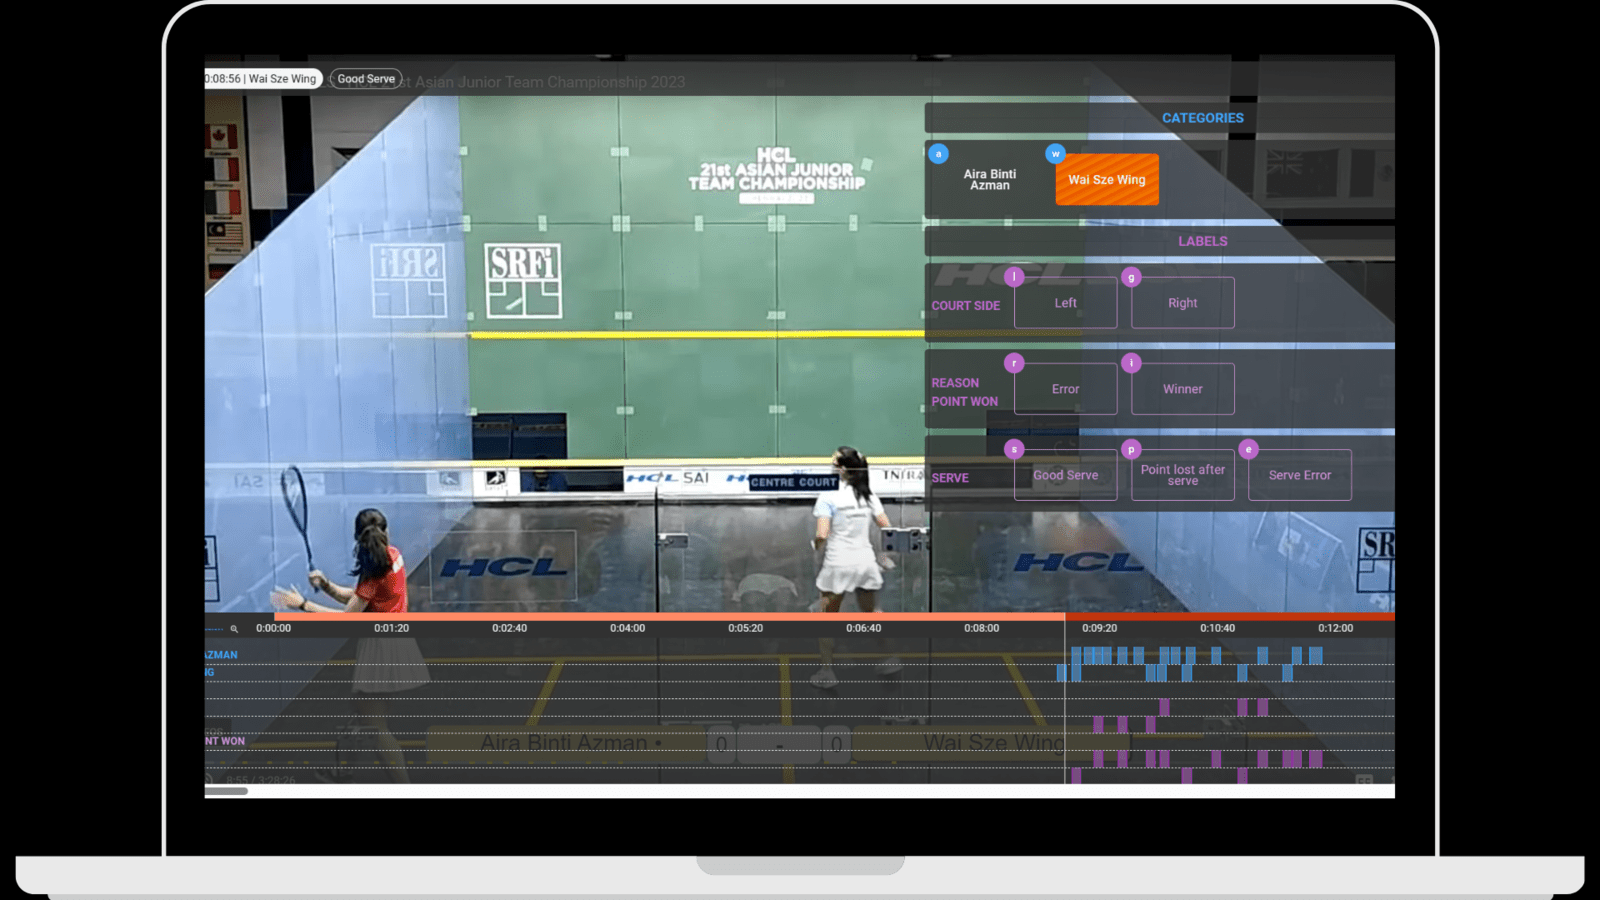
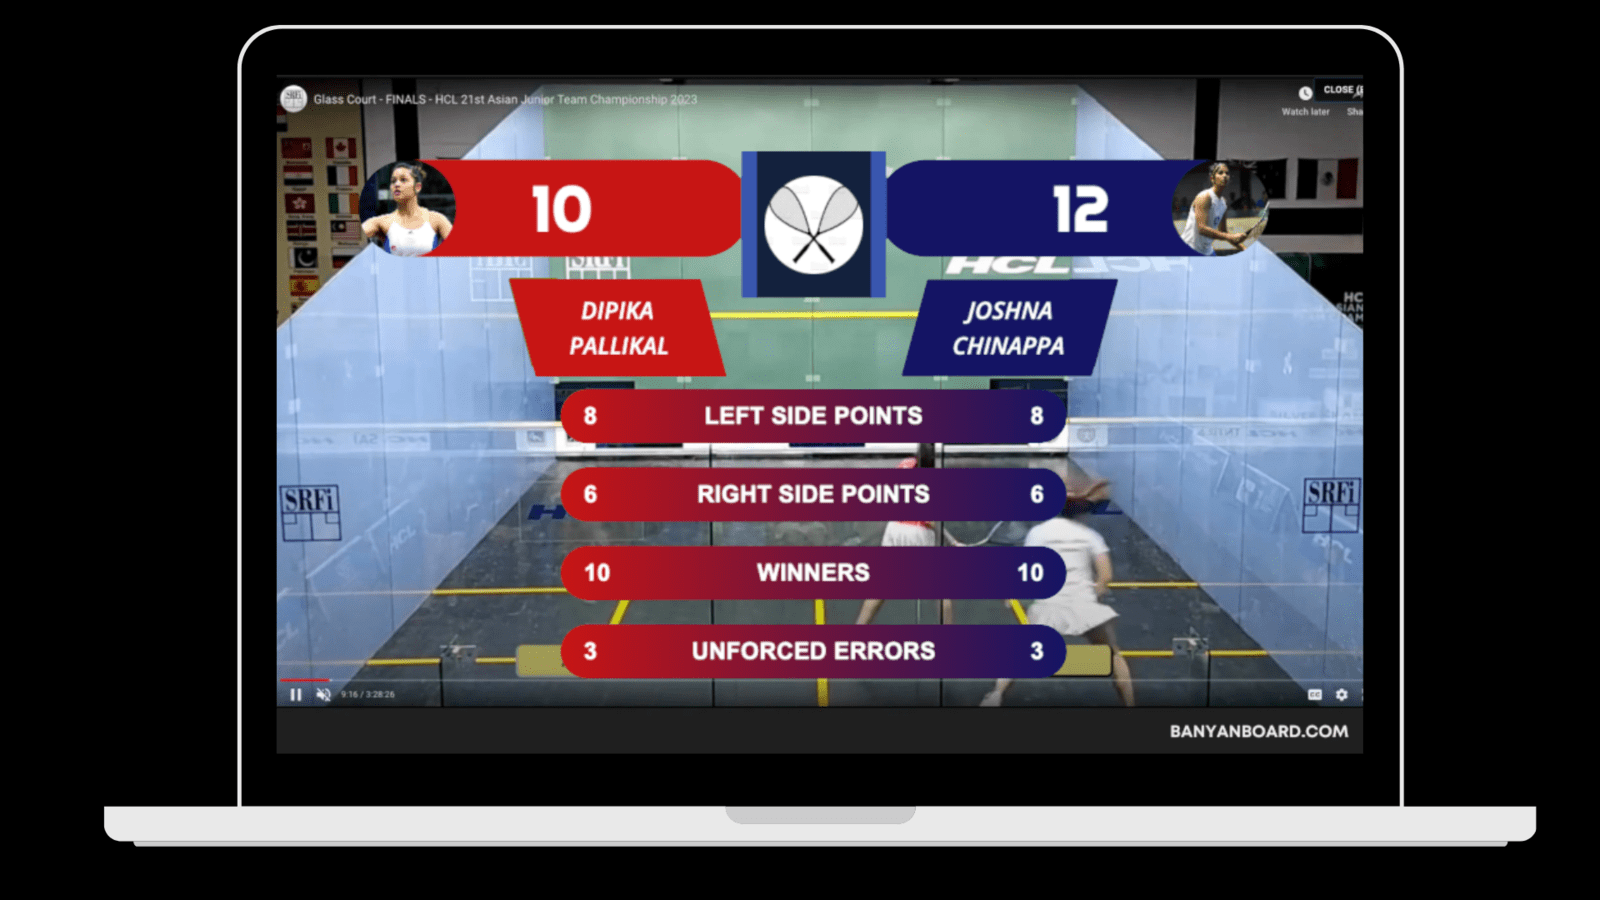
Finally, once all this is ready, we can overlay the produced dashboard on video streams with video production software as seen in the below image. With BanyanBoard, producers can use a single web URL to access multiple dashboards and adjust them based on the ongoing state of the squash game. With this process, we aim to demonstrate the versatility and ease of using BanyanBoard for live streaming squash games, ensuring real-time statistics are readily available to the audience.
As an additional tip, we'd like to highlight the advanced capabilities of BanyanBoard to handle complex scenarios in sports dashboard management. Let's consider an instance where we want to record scores for individual sets in a squash game.
With a tagging template like the one we set up above, merely counting the number of events where a 'score' label was applied wouldn't allow us to distinguish the score in each individual set. For a more granular view, we require a mechanism to record scores for individual sets and sum up only those scores for displaying a set's score.
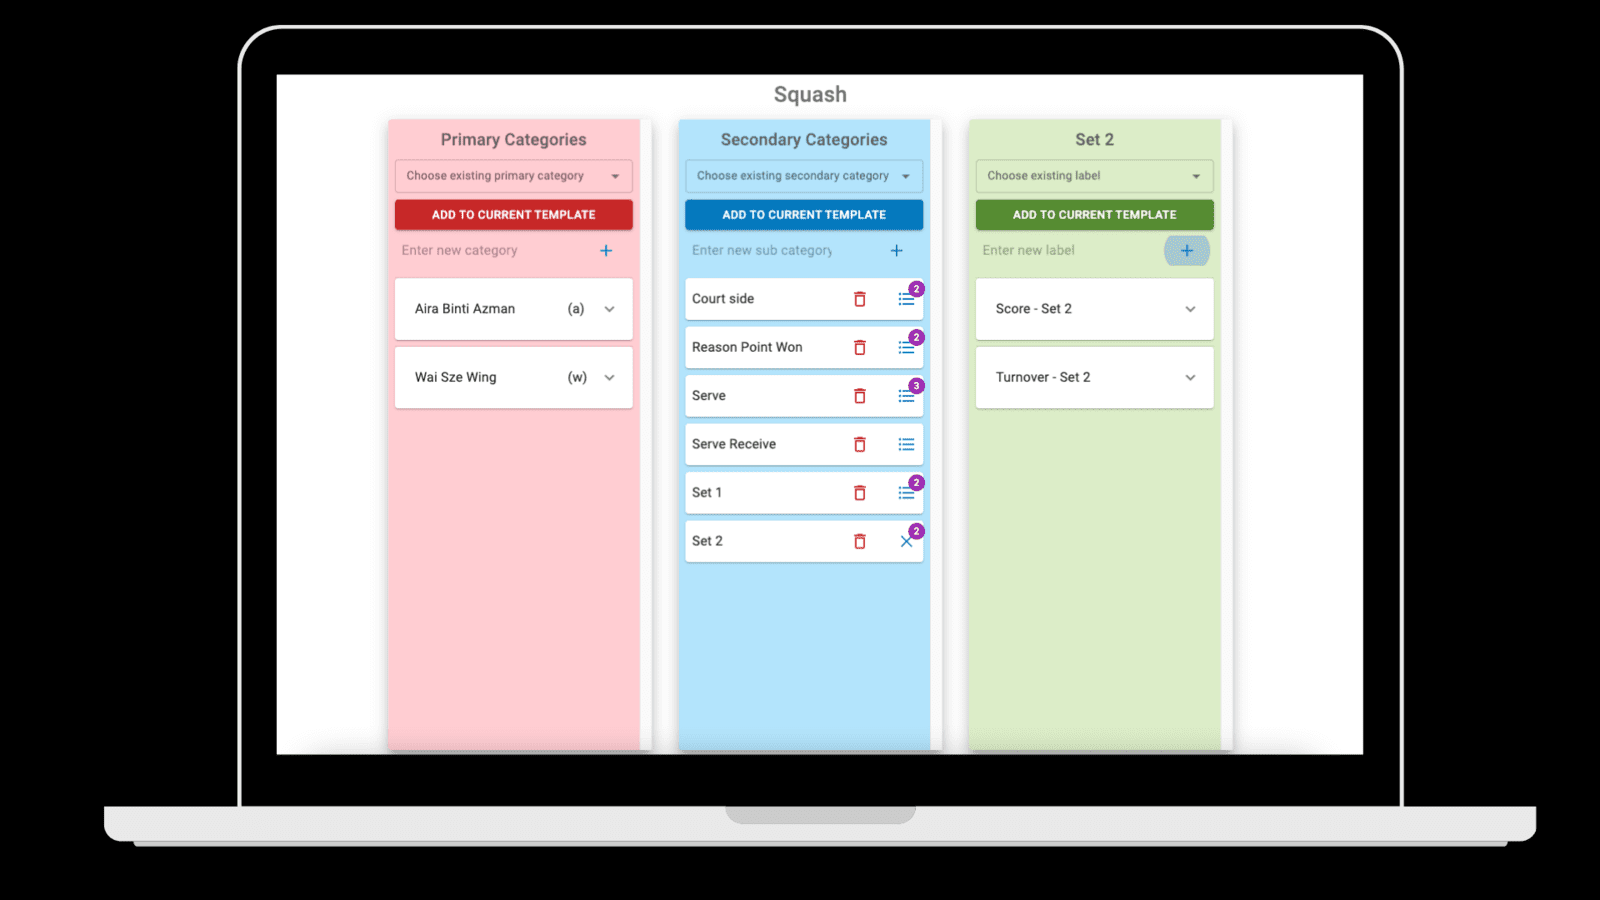
This is where it is useful categorize scores as scores belonging to different sets. This can be achieved by creating 'secondary categories' for sets and adding 'score' labels to each of these sets. This association allows a structured and efficient way to record scoring events in individual sets. Such a template with secondary categories looks like below.
Our goal is to make sports analysis a revenue adder for sports organizations and what better way to do this than to improve broadcast quality for your real-time streams. If you have a Google account, you can sign up with a click and begin exploring these features for free. As a cloud-based platform, BanyanBoard also does not require high-end hardware to function effectively; it operates smoothly on standard laptops, making it an accessible solution for everyone.